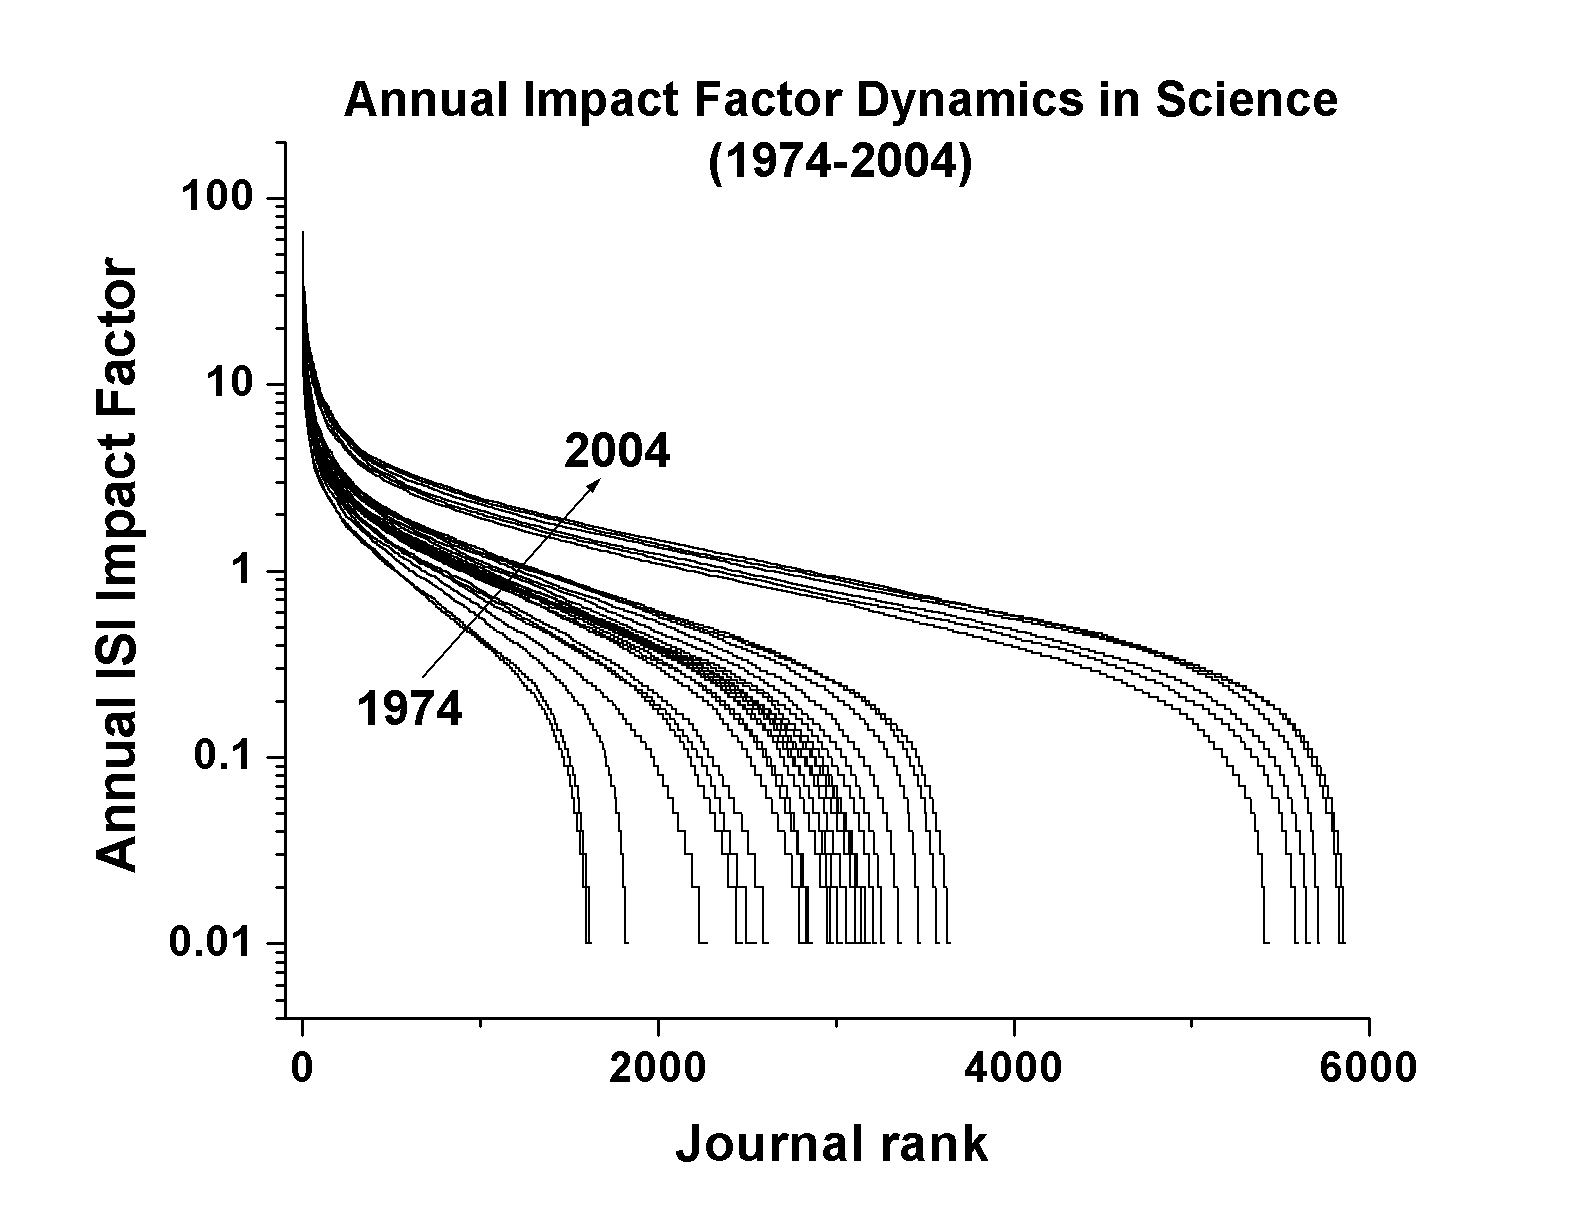
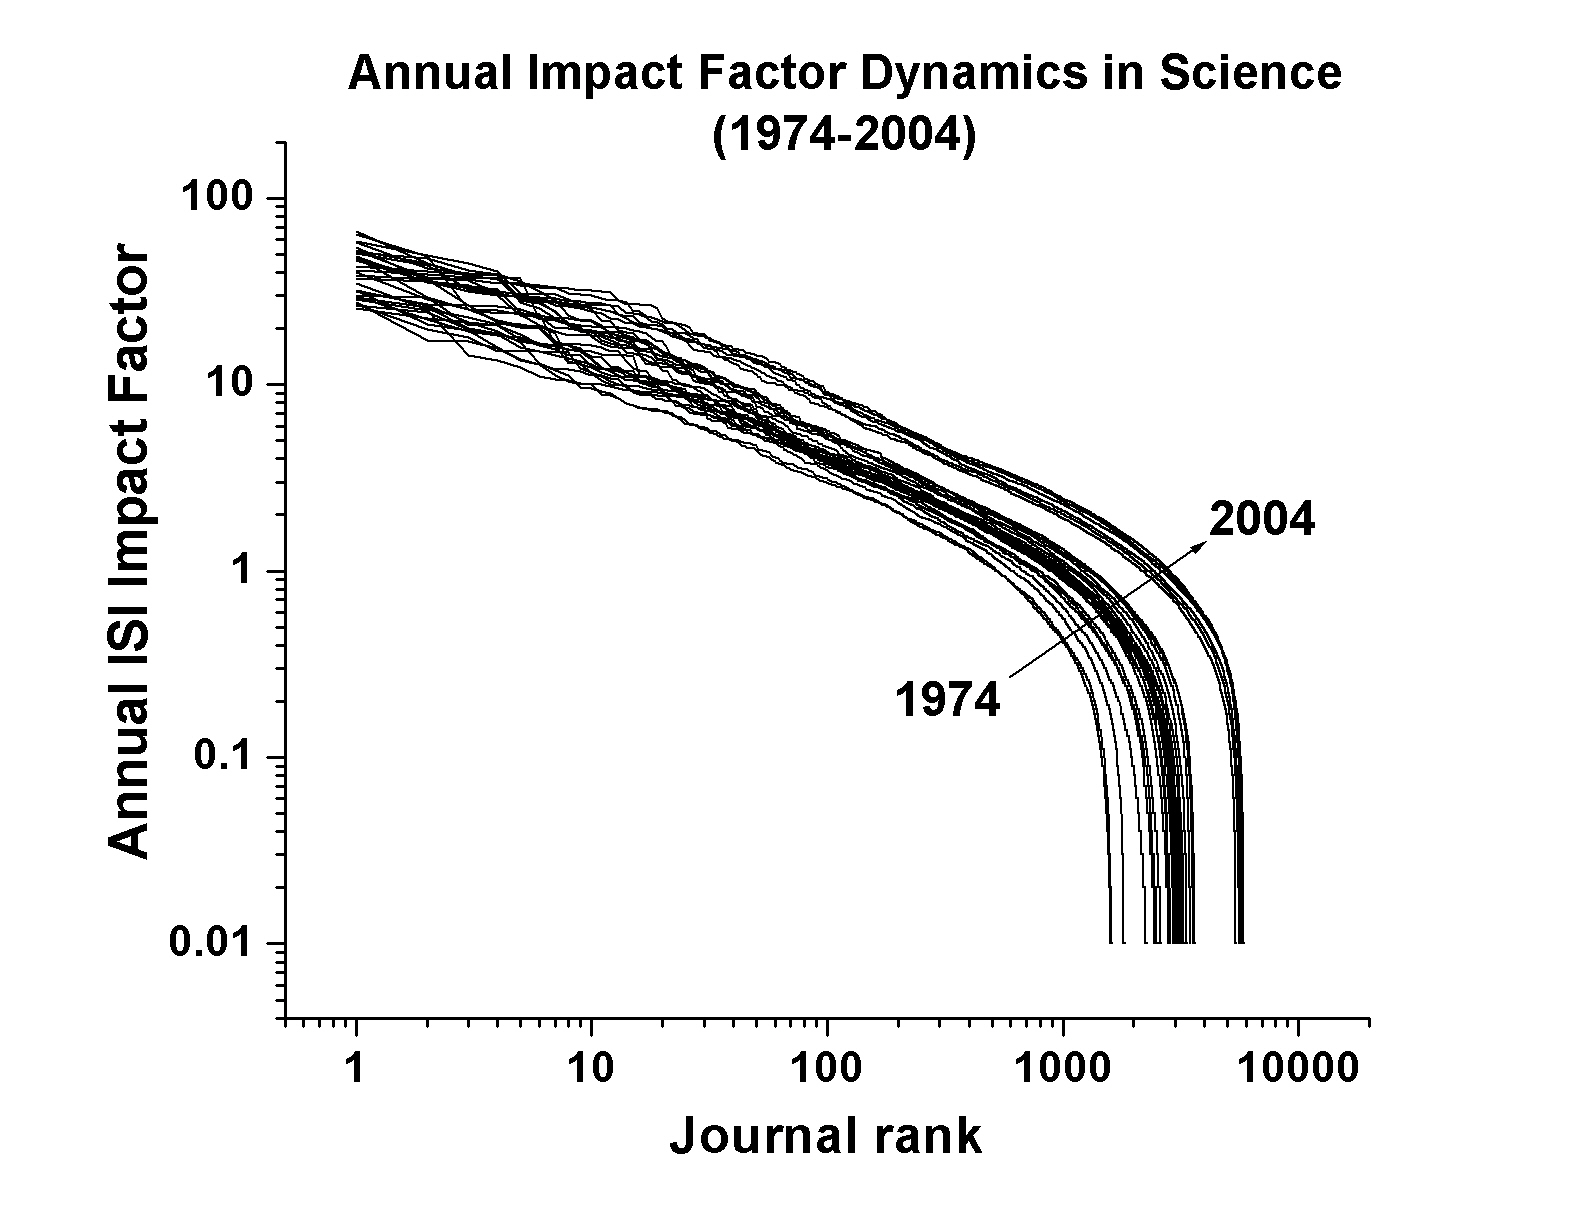
Illustrating
a typical non power law by a downwards curved �log (rank) � log (frequency)�
distribution of science journal ranking by average journal impact factors,
JIF (left figure), and the corresponding distribution of journal ranks,
JRK (right figure), as separately assigned within 107 disciplines. Incidentally,
the journal rank distribution coincides with that of a uniform sequence
of random numbers. Similar relationships hold also true for various subsets
such as scientific fields and disciplines (see figures in ADDENDUM
at the end of the article).
Based on ISI annual data sets
of SCI-JCR (1974-1999)
Motto:�There is something still worse,
however, than being either criticized or dismantled by careless readers:
it is being ignored. Since the status of a claim depends on later
users' insertions, what if there are no later users whatsoever?
This is the point that people who never come close to the fabrication of
science have the greatest difficulty in grasping. They imagine that all
scientific articles are equal and arrayed in lines like soldiers, to be
carefully inspected one by one. However, most papers are never read at
all. No matter what a paper did to the former literature, if no one else
does anything with it, then it is as if it never existed at all.
You may have written a paper that settles a fierce controversy once and
for all, but if readers ignore it, it cannot be turned into a fact; it
simply cannot. �You may protest against this injustice; you may
treasure the certitude of being right in your inner heart; but it will
never go further than your inner heart; you will never go further in certitude
without the help of others.� (Bruno Latour, Science in Action, p. 40 (1987))
Humbly
dedicated to cited scientists
FOREWORD
Bibliometric indicators currently used to examine and
evaluate the published knowledge production are primarily based on impact
factors of journals covered by Science Citation Index database and
published annually since 1975 in the Journal Citation Reports [Garfield
(Editor)]. This concept has been introduced by Garfield [Garfield, 1972,
1979] as a measure of the average citation frequency for a specific citable
item (article, review, letter, discovery account, note, and abstract) in
a specific journal during a specific year or period. Commonly, the impact
factor of a journal is defined as the ratio between citations and recent
(previous two years) citable items published or, in other words, as the
average number of citations in a given year of articles published in that
journal in the preceding two years. Thus, for instance, the impact factor
for 1990 of Physical Review Letters (PRL) has been calculated as
the cumulated number of 22,007 citations received in 1990 for articles
published in the considered journal in 1988 (11,497 citations) and 1989
(10,510 citations), divided by the cumulated number of 2901 citable articles
published in that journal during the same two-year period, i.e. in 1988
(1430 articles) and 1989 (1471 articles). The impact factor of PRL
in the year 1990 results accordingly from the ratio 22,007 citations /
2901 papers = 7.586 citations per paper and has the meaning of number of
citations received by the "average PRL article" during the considered
two-year period. Obviously, the definition can be extended over longer
time spans. For more detailed recent information about impact factors and
their applications and extensions, see also [Garfield, ISI Essays,
1994; PRESTìGIXTM,
2000, 2001]. Thus, for instance, while the impact factor is based
on 4 independent variables (citations in the considered year to articles
published in the preceding two years, and their respective number of articles),
the prestige factor uses a more comprehensive algorithm (PRESTìGIXTM)
containing 6 independent variables (citations in the considered year to
articles published in that year and in the preceding two years, and their
respective number of articles). In other words, the prestige factor uses
more recent data, namely from 1998-2000 for the year 2000, and from 1999-2001
for the year 2001.
Developed originally from the need to compare the journal
influence or performance, the impact factor provides nowadays the main
quantitative tool for ranking, evaluating, categorizing, and comparing
journals. Thus, it provides librarians a tool for the management of journal
collections and publishers a quantitative evidence in evaluating the position
of their journals. But data can as well be ranked to reveal interesting
facts about individual or collective performance and trends, such as highly
cited papers and authors (hot papers, hot authors), most active
laboratories, institutions or research fronts, up to countries and world
science mapping and policy [Aguillo, Braun, Garfield, Katz]. Accordingly,
many institutions worldwide are devoted to information science and technology
based on citation analysis and variously known as scientometrics, bibliometrics,
informetrics, cybermetrics, and webometrics � visit more sites
at USEFUL LINKS in the References. In Romania a specialized department
has recently been created under the Romanian Ministry of Education and
Research, namely CENAPOSS, an acronym for the National Center for Science
Policy and Scientometry, set up at the end of 1999.
"Perhaps the most important and recent use of impact
is in the process of academic evaluation. The impact factor can be used
to provide gross approximation of the prestige of journals in which individuals
have been published. This is best done in conjunction with other considerations
such as peer review... Again, the impact factor should be used with informed
peer review" [Garfield, 1994]. Methods and techniques are currently designed
for evaluation and comparison of research groups and individual scientists,
such as the so called ISI�s Expected Citation Rates (ECR) System
[Garfield, 1994] and ISSRU�s precursory Mean Expected Citation Rates
(MECR), Mean Observed Citation Rates (MOCR) and Relative Citation
Rates (RCR) [Braun, 1985-1988].
A simple scientometric evaluation of individual
and group contributions in fundamental science has recently been proposed
and a particularly relevant scientometric indicator has been introduced,
namely the cumulative impact factor [Popescu, 1994], defined by
the sum :
S [(journal impact factor, q) / (article
author number, a)]
or, shortly, S (q/a), extended over the
whole list of scientific publications of the assessed individual or group.
Obviously, the cumulative impact factor has the meaning of author�s total
number of citations per author in the first two years after publication,
with its unit cites/author at this paper age. This unit is equivalent
to a single-authored (a = 1) article, published in a journal with
impact factor unity (q = 1).The
cumulative scientometric indicator defined above has successfully been
tested for promotion thresholds in Romanian physics research institutes
and faculties [Romanian Ministry of National Education, Order No. 5103,
Appendage 1-II, dated on 05.07.1999] and for accreditation of research
excellence centers in Mathematics, Physics, and Chemistry [Romanian CNCSIS
- National Council of Scientific Research in Higher Education].
The necessary thresholds resulted from the "Romanian experiment" for any
candidate to a high academic position or grade are, for instance, a minimal
score of 6 to 8 points for associate university professor, of 9 to 12 points
for full university professor, and of 14 points for Ph.D. supervisor. In
other words, these minimal promotion scores require the equivalent
of 6-8, 9-12, and 14 single-authored papers respectively, published in
unity-valued impact factor journals. The conversion of these figures from
the field of physics to any other scientific field can easily be carried
out by multiplying with the ratio of the corresponding average impact factors
(AVEJIF) given in the linked SUMMARY
Version 2001(or in SUMMARY_Version_2002,
inasmuch as the AVEGIF-values remain essentially the same). Thus, for instance,
for ENGINEERING SCIENCES, the minimal promotion scores given above for
PHYSICAL SCIENCES should be reduced by a factor of
(AVEJIF)ENG / (AVEJIF)PHYS = 0.42/1.41 »0.3.
Clearly,
a high number of citations mean a major impact in the specific field or
a high utility. However, as pointed out above, it is critical to take into
account, among other aspects, that publication and citation rates, as well
as the peak impacts, vary widely from field to field, and among different
disciplines, and we need to know what the average citation rate is within
a field and a discipline to assess an individual. To illustrate this diversity,
the current average values of impact factors for 12 scientific fields and
107 scientific disciplines are given in the SUMMARY_Version_2001
or, respectively, in the updated version SUMMARY_Version_2002
. A convenient alternative way to consider this requirement consists in
the use of the relative rank, r, of the journal within its discipline
instead of the impact factor, q. The grounds consist in the fact
that, according to the Lavalette ranking law [Lavalette, 1996; Popescu,
1997; see also ADDENDUM ],
there exists a simple functional dependence between r and q,
namely
q = c [Nn/(N-n+1)]-b
= c [(N+1)/r -
N]-b
where the positive exponent
b (roughly 1/2) and the scaling factor c are two fitting parameters,
N
is the total number of journals in the considered discipline, and
r = 1 - (n - 1)/N
defines the journal (relative)
rank, corresponding to its (descending absolute) ranking number n.
Thus, for instance, a value r = 0.75 means that 75 % of journals
of the considered discipline have a rank (and the corresponding impact
factor) lower or equal to that of the considered journal. Incidentally,
the journal rank distribution coincides with that of a uniform sequence
of random numbers TOP (right). For many reasons,
mainly in interdisciplinary comparisons and evaluations, it appears therefore
more appropriate to use a "normalized" indicator such as the cumulative
rank, defined by:
S [(journal rank, r) / (article author number,
a)]
or simply, S (r/a), with its natural
unit rank. This unit is equivalent to a single-authored (a
= 1) article, published in the discipline top journal (r = 1). The
major
advantages of the "ranks scale" S (r/a) in comparison
with the "cites scale" S (q/a) consist in
both (i) a bibliometric equivalence of journals belonging to various
disciplines but having the same rank, and (ii) a much higher stability
as compared to the corresponding impact factor. Generally, the journal
rank r = 1 - (n -
1)/N ranges from unity (for top journals)
to 1/N (for bottom journals). It follows, thus, that the journal average
rank of scientific disciplines (or fields) is given by (1+1/N)/2 »
1/2, as far as N >> 1. This narrow distribution
of average rank values, in contrast to that of average impact factors,
indicates the "normalization" of the rank scale notwithstanding the variety
of disciplines and fields displayed in the attached SUMMARY_Version_2001
or SUMMARY_Version_2002 tables,
and illustrated in the TOP (right) figure
by the normalized linear distribution of journal ranks. Consequently, the
rank scores and the promotion, appointment, and accreditation thresholds,
established in the cites scale, S (q/a),
can be roughly converted into the rank scale, S
(r/a), by simply multiplying by the ratio 0.5/AVEJIF.
Obviously, for the use of the rank scale it is of major
importance the proper placement of journals into various possible disciplines.
In the present database version, as a general rule, each journal has been
"optimally assigned" to one (and only one) discipline, namely to the 1999-ISI
discipline in which that journal has the optimal position, i.e. the highest
rank number. Thus, for instance, the journal Int. J. Mod. Phys. C has
the rank r = 0.80 in the discipline Computer Sciences (Interdisciplinary)
and the rank r = 0.40 in the discipline Mathematical Physics. In
a similar way, the journal J. Magn. Magn. Mater. has the rank r
= 0.82 in the discipline Material Sciences and the rank r = 0.57
in the discipline Condensed Matter Physics. In the previous database version
(July 2000), both these journals were located in the field PHYSICS, namely
in the disciplines Mathematical Physics and Condensed Matter Physics, respectively.
In the present version, however, by virtue of the aforementioned principle
of maximal positioning (ranking) within possible disciplines, the two journals
of the example given above have been assigned to the discipline Computer
Applications of the field COMPUTER SCIENCES, respectively to the discipline
Materials of the field MATERIALS SCIENCES. Thus, it happens that some interdisciplinary
journals rather get out of their "traditional" or "intuitive" discipline
and move into more related ones. The biggest number of disciplines into
which ISI arranged journals in 1999 is 6 (six) as, for instance, the journal
Chem-Biol.
Interact., which appears in Chemistry (r = 0.83), Toxicology
(r = 0.82), Chemical Medicine (r = 0.77), Biology (r
= 0.74), Pharmacology and Pharmacy (r = 0.72), and Biochemistry
and Molecular Biology (r = 0.54). According to the rule adopted
here, the journal in this later case has been allotted to the Chemistry
discipline. Perhaps the most useful table needed for further improvement
of discipline definition and journal allocation consists in the word frequency
listing of scientific journal titles. The one corresponding to the latest
records, containing the vocabulary and the occurrence frequency of (mostly
abbreviated) 4196 distinct words used in the titles of 7832 science journals,
can be found in the TXT file: Science_Journal_Titles_Word_Frequency_Version_2002
(65KB).
In order
to meet the increasing needs of journal impact factors for a variety of
purposes, this work stands for a completed and updated continuation
of the previous versions (Popescu, version December 1999, with 2,935 journals;
version July 2000, with 5,762 journals). It represents at this time (of
version 2001) a collection of 7,557 journals and their 93,618 annual impact
factors from SCI Journal Citation Reports of general and special
interest to scientists engaged in fundamental, life and engineering sciences,
and covering all available journal impact factors in the window 1974-1999
(excepting the not edited 1976 year). Thus, the "ever-changing river of
journals", has an average lifetime of [93,618 (years) / 7,557 (journals)]
»
12.4 years/journal, i.e. of about one half of the considered effective
25 years of ISI quotation. The linked
SUMMARY_Version_2001
(and, similarly, SUMMARY_Version_2002)
presents the data of the corresponding 12 scientific fields and 107 scientific
disciplines, with their brief definition, the journal number N, the discipline
(field) weighted average journal impact factor (AVEJIF), and the discipline
or field top journal title and its impact factor in 1999 (or in 2000, respectively).
As to the news in the version 2001, compared with previous versions,
these are mainly the domains of MEDICAL SCIENCES (1906 journals) and AGROSCIENCES
(487 journals), so that the present database displays the main stream of
all scientific journals. For convenience, the actual database will
be divided into separate Excel files and links to each of the 12 scientific
fields, as given in the following list. Also the currently updated database
version 2002 is added below, confirming, as expected, the stabilization
of the average impact factors:
Each sheet is self-explanatory, has a heading, a legend, and the same Excel
format, with the following columns, namely: identification number (ID),
DISCIPLINE,
journal rank (JRK), abbreviated JOURNAL TITLE, average journal
impact factor (JIF) for the entire time span of ISI quotation, the
corresponding number of years of ISI quotation (YRS), and the impact
factor standard deviation (DEV). The rank JRK of journals
has been established FOR EACH DISCIPLINE SEPARATELY in terms of the ranking
by average journal impact factor JIF.These particularly important
columns JRK and JIF (yellow filled) stand by on the left and right side,
respectively, of the JOURNAL TITLE column. Journal ranking by average scientometric
indicators, such as by the average impact factors in the present application,
could serve for simple uses of extant data in any assessment of research
performance for hiring, promotion, tenure, appointment, accreditation,
and other academic rewards. The TOP FIGURE
summarizes both scientometric evaluation alternatives, i.e. by journal
absolute average impact factor and/or by journal rank within the corresponding
discipline. For link to the corresponding scientometric tables in TXT
files (easy to copy and paste) click on the following addresses:
As expected, the annual data �shift� of the considered consecutive years,
as measured by the average standard deviation, ranges within percents,
namely of 5.1% for JRK and of 2.6% for JIF. Still lower becomes this deviation
at larger journal set scales (disciplines < fields < science), such
as that of weighted average journal impact factors (AVEJIF) of disciplines
(1.15%) > of fields (1.10%) > of the complete science journal listing (0.86%),
click on SUMMARY_Version_2001_versus_2002
(35 KB).
Generally, the (counted or estimated) citations in the scientific
literature appear to be the most objective measure of any hierarchy by
scientific output. Though far from perfect (see, for instance, a recent
"anti-scientometric" essay [Kutzelnigg, 1998], criticism [Amin and Mabe,
2000; Adam, 2002], or the sophisticated scientometric algorithm
PRESTìGIXTM),
the
simple �poor man�s citation indicators� proposed above enable to examine
several key facets of individual and collective knowledge production.
Almost the same results one gets appealing to rather expensive and time
consuming direct citation counts. Actually, a �high resolution scientometry�
becomes nonsensical inasmuch as needs merely consist in gross definitions
of thresholds, classes,
and trends.Wondering to
which scientometric classes might really belong angry anti-scientometric
people, it would be, however, gratifying if some day scientists will bear
with pride objective cumulative ranks above traditional scientific ranks
and distinctions.
Acknowledgements. The author gratefully appreciates the
interest in this work of Professor Tibor Braun, Professor Daniel
Lavalette, and Professor Mircea Oncescu. Special thanks are due to Dr.
Victor
Sofonea for documentation, Mr. Claudiu Cezar Vasilescu, Dr. Savu-Sorin
Ciobanu and Dr. Magdalena Nistor for computer assistance, and Dr.
Andrei Barborica, Dr. Eugen Aldea and Mr. Sorin Vizireanu for database
programs and homepages. The Alexander
von Humboldt-Foundationis gratefully acknowledged for generous
donations of computer facilities.
Isidro F. Aguillo (Editor), Cybermetrics, International Journal
of Scientometrics, Informetrics and Bibliometrics, published by Centro
de Información y Documentación Científica (CINDOC,
http://www.cindoc.csic.es/)
of the Consejo Superior de Investigaciones Científicas (CSIC,
http://www.csic.es/),
Joaquín Costa 22, 28002 Madrid, Spain (isidro@cindoc.csic.es).
Cybermetrics
is both an electronic-only journal and a virtual forum open to worldwide
researchers to publish, discuss and disseminate their findings to a greater
audience on the Internet.
T. Braun (Editor-in-Chief),Scientometrics, An International
Journal for all Quantitative Aspects of the Science of Science, Communication
in Science and Science Policy, published by Akadémiai Kiadó,
P.O.Box 245, H-1519 Budapest, Hungary (http://www.akkrt.hu),
and Kluwer Academic Publishers, P.O.Box 17, 3300 AA Dordrecht, The Netherlands
(http://www.wkap.nl). The journal
Scientometrics
has been founded in 1979 within the Information Science and Scientometrics
Research Unit (ISSRU) of the Hungarian Academy of Sciences and awarded
the international Derek John de Solla Price medal for outstanding
achievements in scientometrics - so far to the following scientists: Eugene
Garfield (USA 1984); Michael J. Moravcsik (USA 1985); Tibor Braun (Hungary
1986); Vasiliy V. Nalimov (USSR 1987) and Henry Small (USA 1987); Francis
Narin (USA 1988); Bertram C. Brookes (UK 1989) and Jan Vlachý (Czech
Republic 1989); András Schubert (Hungary 1993); Robert K. Merton
(USA 1995) and Anthony F.J. van Raan (The Netherlands 1995); Belver C.
Griffith (USA 1997); John Irvine (UK 1997) and Ben R. Martin (UK 1997);
Wolfgang Glänzel (Hungary 1999) and Henk F. Moed (The Netherlands
1999); Leo Egghe (Belgium 2001) and Ronald Rousseau (Belgium 2001). The
founder and director of ISSRU is Professor Dr. Tibor Braun, Institute
for Inorganic and Analytical Chemistry, L. Eötvös University,
P.O. Box 123, 1443 Budapest, Hungary, E-mail: h1533bra
@ella.hu
T. Braun, Scientometric Indicators. A 32 Country Comparison of
Publication Productivity and Citation Impact (with W. Glänzel
and A. Schubert), World Scientific, Singapore, pp. 346-399 (1985); Relative
Indicators and Relational Charts for Comparative Assessment of Publication
Output and Citation Impact (with A. Schubert), Scientometrics, Vol.
9, Nos 5-6, 281-291 (1986); Against Absolute Methods: Relative Scientometric
Indicators and Relational Charts as Evaluation Tools (with A. Schubert
and W. Glänzel), Handbuch of Quantitative Studies of Science and Technology,
A.F.J. van Raan (editor), Elsevier, North-Holland, pp. 137-176 (1988)
E. Garfield (Editor),Science Citation Index, Journal Citation
Reports: a bibliometric analysis of science journals in the ISI database,
published by the Institute for Scientific Information (ISI, http://www.isinet.com/),
3501 Market Street, Philadelphia, PA 19104, USA, a worldwide leading provider
of information for researchers. On September 15, 2000, Dr. Eugene Garfield,
ISI�s founder and chairman emeritus, celebrated his 75th birthday at the
company�s headquarters in Philadelphia (The Web of Knowledge, A Festschrift
in Honor of Eugene Garfield, visit http://www.infotoday.com/catalog/asist.htm).
Many of Garfield�s writings can be found at his Web site at http://www.garfield.library.upenn.edu/.
Some are pointed out below. On June 7, 2001, Dr. Henry Small has
been named the Chief Scientist of ISI. Starting with his milestone paper
Co-citation
in the scientific literature: A new measure of the relationship between
two documents, J. Am. Soc. Inform. Sci., Vol. 24, 265-269 (1973), Dr.
Small is recognized for his outstanding contributions to co-citation analyses,
citation mapping, and visualization techniques. "It was exciting to find
that co-citation arrayed highly cited documents so cleanly into specialties,
and that, in turn, specialties could join to form a global map" (1998 ASIS&T
Award of Merit to Henry Small: On the Shoulders of Giants, Bull.
Am. Soc. Inform. Sci., Vol. 25, No 2, December/January 1999, http://www.asis.org/Bulletin/Jan-99/small.html).
Since 1992 ISI is a Thomson Scientific Company, and part of The
Thomson Corporation (visit http://www.thomson.com/),
providing high-quality essential Web-based information products for researchers,
information specialists, and administrators in diverse fields. For more
information about ISI, visit http://www.isinet.com/isi
and particularly the following recent and most popular web-publications
and sites:
E. Garfield, Citation Analysis as a Tool in Journal Evaluation,
Science, 178, 471- 479 (1972); Citation Indexing, Its Theory
and Application in Science, Technology, and Humanities, John Wiley
& Sons, New-York (1979); The Impact Factor, Current Contents,
25,
3-7 (June 20, 1994); Using the Impact Factor, Current Contents,
29,
3-5 (July 18, 1994); Expected Citation Rates, Half-Life, and Impact
Ratios, Current Contents (September 12, 1994); Research Fronts,
Current Contents, 41, 3-7 (October 10, 1994);Scientography:
Mapping the Tracks of Science, Current Contents (November 7, 1994);
available also at http://www.isinet.com/hot/essays
J. S. Katz, Questions of Collaboration (with D. M. Hicks),
Nature, 375, 99 (11 May 1995); Desktop Scientometrics, Scientometrics,
8 (1) 141-153 (1997); What is Research Collaboration (with B. R.
Martin), Research Policy, 26, 1-18 (1997); Indicators for Systems
of Innovation:A Report on the IDEA (Indicators and Data for European
Analysis) Project (with D. M. Hicks), IDEA Paper Series, 12,
1-66 (1998); The Self-Similar Science System, Research Policy, 28,
501-517 (1999); Scale-Independent Indicators and Research Evaluation,
Science and Public Policy (6 March 2000); some available athttp://www.sussex.ac.uk/spru/jskatz;http://www.sol.no/step/IDEA
W. Kutzelnigg, Nachr. Chem. Tech. Lab., 46, 826-831 (1998)
B. Latour, Science in Action, Milton Keynes: Open University
Press (1987)
D. Lavalette, Facteur d�impact: impartialité ou impuissance
?, Internal Report, INSERM U350, Institut Curie - Recherche, Bât.
112, Centre Universitaire, 91405 Orsay, France (November 1996), http://www.curie.u-psud.fr/U350/
I.-Iovitz Popescu, A Simple Scientometric Assessment of Individual
Contributions in Fundamental Physics, Romanian Reports in Physics,
46,
899-905 (December 1994); On the Lavalette Ranking Law (with M. Ganciu,
M. C. Penache, and D. Penache), Romanian Reports in Physics,
49,
3-27 (January 1997); Journal Impact Factors of Interest to Basic Sciences,
Version December 1999, Horia Hulubei Publishing House, Bucharest (December
1999); Journal Ranking and Average Impact Factors of Basic and Allied
Sciences, Version July 2000, 60 pages, Horia Hulubei Publishing House,
Bucharest (October 2000); Science Journal Ranking and Average Impact
Factors, Version October 2001, Horia Hulubei Publishing House, Bucharest
(pending 2002); for electronic versions 2000 and 2001 see web sites at
URL: http://www.geocities.com/iipopescu;
http://alpha2.infim.ro/~ltpd/iipopescu.html
Romanian Ministry of National Education, Order No. 5103, Appendage
1-II, dated on 05.07.1999
Romanian Ministry of Education and Research, CENAPOSS - an acronym
for the National Center for Science Policy and Scientometry, a departament
of CNCSIS - National Council of Scientific Research in Higher Education,
http://www.cncsis.ro/cenaposs/inform.html
(1999)
C. Tsallis and M. P. de Albuquerque,Are citations of scientific
papers a case of nonextensivity ?, Eur. Phys. J. B, 13, 777-780
(2000); web site http://tsallis.cat.cbpf.br/biblio.htm
J. S. Katz and L. Katz,Power laws and athletic performance,
J. Sport Sciences, 17, 467-476 (1999)
S. Redner,How popular is your paper ? An empirical study of
the citation distribution, Eur. J. Phys. B, 4, 131-134 (1998)
J. Laherrère and D. Sornette,Stretched exponential distributions
in nature and economy: "fat tails" with characteristic scales, Eur.
J. Phys. B, 2, 525-539 (1998)
G. L. Barenblatt,Scaling, self-similarity, and intermediate
assumptions, Cambridge Univ. Press (1997)
B. B. Mandelbrot,Fractals and scaling in finance: discontinuity,
concentration, risk, Springer Verlag (1997)
M. Buchanan,One law to rule them all, New Scientist (November
8, 1997)
G. K. Zipf, Human Behavior and the Principle of Least Effort: An
Introduction to Human Ecology, Cambridge, MA, Addison-Wesley (1949); 2nd
edition, New York, Hafner (1965); a comprehensive bibliography on Zipf's
Law has been gathered by W. Li from Rockefeller University at http://linkage.rockefeller.edu/wli/zipf/
The ranking law, established in 1996 by the French
biophysicist Daniel Lavalette (http://www.curie.u-psud.fr/U350/),
states that the impact factor q of a set of N scientific
journals, ordered by the descending ranking number n (a positive
integer in the [1, N] range), obeys the general relationship
q (n)= c [Nn/(N-n+1)]-b
with only two fitting parameters, namely the exponent b and the
scaling constant c = q(1). In other words, the expression proposed
by Lavalette represents a linear function in the double logarithmic log(q),
log [n/(N-n+1)] scale. Offering the promise for various applications
and theoretical investigations, this is barely more complex than the well
known rank-frequency Zipf�s law q = c n-b.
It is important to point out that the independent variable in the Zipf�s
law is the descending ranking number, n, whereas in the Lavalette�s
law this is the ratio n/(N-n+1) between the descending and the ascending
ranking numbers, thus explicitly enclosing the set size number N.
Fig.1.The normalized Lavalette ranking function q/c
= [Nn/(N-n+1)]-b
in terms of the descending ranking number n for typical values of
the parameters N and b.
.
Fig.2. Illustrating the Lavalette ranking law for three
random subsets (1000, 2000, and 4000 journals) excerpted from the present
collection (7557 journals) and ranked by average journal impact factors
(JIF). The journals with JIF = 0 have been excluded.
Fig.3.
Illustrating the Lavalette fitting for 4 random subsets of journals with
title initial letter A, B, C, or D, as excerpted from the present collection
(7557 journals) and ranked by average journal impact factors (JIF).
Fig.4.
Ranking of 26 random subsets of journals with title initial letter belonging
to various letters of the alphabet, as excerpted from the present
collection (7557 journals) and ranked by average journal impact factors
(JIF). The non power law shaping is obvious and the fitting pleasure is
left to the reader (power
law means straight line on log-log plot).
Fig.5. Illustrating the Lavalette ranking law for the
present collection (7557 journals) and two disjoint subsets of the fields
of Medicine (1906 journals) and Physics (575 journals) respectively, ranked
by average journal impact factors (JIF). The journals with JIF = 0 have
been excluded.
Fig.6.
Ranking of 12 natural subsets of journals belonging to various scientific
fields, as excerpted from the present collection (7557 journals) and ranked
by average journal impact factors (JIF). The non power law shaping is obvious
and the fitting pleasure is left to the reader (power
law means straight line on log-log plot).
Fig.7. Testing of Lavalette�s variable
Nn/(N-n+1)
for the average impact factors (JIF) of 7557 journals, as assigned within
12 scientific fields, shows a systematic departure from a perfect Lavalette
fitting, i.e. from a straight line on a log(JIF), log [Nn/(N-n+1)]
plot.
Fig.8.
Illustrating the King�s effectin
the particular case of the Science
& Education field, as revealed by the
first three positions held by Nature
(JIF = 15.68), Science
(JIF = 14.31), and P.
Natl. Acad. Sci. USA (JIF = 9.53), in contrast to the field
average journal impact factor amounting only to AVEJIF = 0.88. The
matching to the rest of the sequence can be substantially improved by simply
eliminating the anomalous members.
This
is a page of the site:
Prof.
dr. Ioan-Iovitz POPESCU
Member
of the Romanian Academy
Vita
et Opera: Plasma, Lasers, Scientometrics
